Behaviour change – the life cycle

The success of our Workplace Cycle Challenges is based on the philosophy that the experience of riding a bike, even for just 10 minutes, is a powerful enough tool to encourage behaviour change. For those who have never ridden or who have had a period of cycling inactivity, this first-hand knowledge or reminder of what it feels like to ride a bike leads to an increase in cycling uptake.

After trying a bike the participant has their own positive personal experience which they can draw upon to at a later stage. But how do we know if they are actually going to continue to cycle or increase their cycling behaviours?

Challenge participants are asked about their cycling behaviour at baseline registration and three months after taking part in a Workplace Cycle Challenge. Longevity in behaviour change is hard to achieve but by using these survey responses from repeat Challenges we are able to plot cycling frequency behaviour data from four time points.

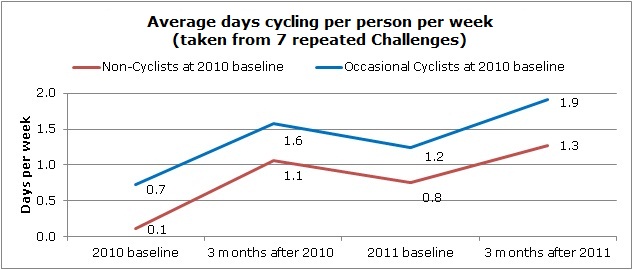
The average trip data from seven Workplace Cycle Challenges has been analysed. Each response segment was re-coded numerically and the following graph shows the change in cycling behaviour amongst 143 non-cyclists and 131 occasional cyclists who logged trips in 2010 and 2011 Challenges. All participants had also completed the three month post-Challenge surveys for each of their Challenges.

Three months after the 2010 Challenge to the start of the 2011 Challenge there was a 28% and 22% drop in cycling frequency amongst those classed as non- and occasional cyclists respectively at the start of the 2010 Challenge.

On average, ten months after taking part in their first Challenge:

  • Non-cyclists cycled six times more often
  • Occasional cyclists cycled 71% more often

On average, after taking part in two annual Challenges:

  • Non-cyclists showed a ten-fold increase in their cycling
  • Occasional cyclists showed a 164% increase in their cycling

As Challenge for Change return to previous Challenge cities and regions across the UK in 2012, we look forward to further understanding the positive impact of our programmes over time and the part they play in creating a sustainable future.


Road safety – food for thought

Earlier this month the BBC recently posted an interactive online article morbidly titled “Every death on every road in Great Britain 1999 – 2010”. The results in the article are particularly worrying considering that fatalities in 2010 were down by 17%: the greatest post-war decrease. According to their report based on police records, 1,850 died on UK roads in 2010, which is still 5 lives lost each day.

The notion is put forward that the trend in road casualties is linked to the speed of the economy. The recession is deemed double-edged, bringing with it a reduction in both capital and interestingly, road casualties. With the economy flat lining for the first half of this of year, with it came the first rise in road deaths for four years: up 7% between April and June.

Combine this with the government’s central target for reducing deaths by the end of the decade set at just 4.7%, fears are mounting that the message of road safety is being pushed to the kerb. The government has defended the drop of national road safety targets saying that they are not needed to prove their commitment to saving lives.

Aside from the politics, it is more about raising safety awareness amongst road users in the bid to promote safer travel on Britain’s roads. In November, the Guardian online published a visual data map of all 32,955 deaths and 3m injuries between 2000 and 2010. The figures in the report came from Stats 19 – a police data set from the Department for Transport which were analysed by transport data mapping experts ‘ITO World’. The interactive map is a fascinating tool. It allows you to explore any area across the country, but it’s hard to not let the bright key colours detract from the severity of the information they represent.

Hopefully these statistics and all the ‘did you know?’ facts, live reports and time-lapse maps will help motorists, cyclists and pedestrians alike realise the potential danger in their journeys. The aim isn’t to put people off, but more consider the manner in which they get from A to B.

A recent report by the CTC highlights the link between increases in the number of people cycling and the reduction in cyclists’ fatalities. The ‘Safety in Numbers’ campaign was devised using an evidence-based approach and aims to halve the risk of cycling by doubling the number of cyclists. So it’s a positive cycle: by getting more people cycling we’re actively increasing cyclists’ safety on the roads.